It’s extremely challenging for MEV newcomers to profit from popular strategies. That’s why, I’ve refined my searching approach to focus on niche and less obvious opportunities. In this blog post, I’ll showcase a Rust CLI tool that helps me query blockchain data to discover long-tail MEV. I will also describe Revm vs RPC EVM tracing techniques and their performance characteristics.
Disclaimer: The information provided in this blog post is for educational purposes only and should not be treated as financial advice.
How to monitor EVM chains for MEV opportunities?
Searching for long-tail MEV requires investigating and analyzing nonobvious transaction details.
Popular tools like libmev.com or eigenphi.io focus on short-tail MEV like arbitrage and liquidations. It’s possible to extract all the transaction data from Etherscan, but I find it cumbersome to click around web UIs. It takes over five clicks to get neighboring (before/after) tx info… Also, please tell me why does Etherscan display block transactions in reverse order? Isn’t the top of the block always the most interesting??
(╯°□°)╯︵ ┻━┻
I’ve found myself writing one-off scripts parsing blockchain data to extract relevant info. So, I’ve decided to develop them into a simple to use CLI for querying blockchain with configurable EVM tracing and filtering options.
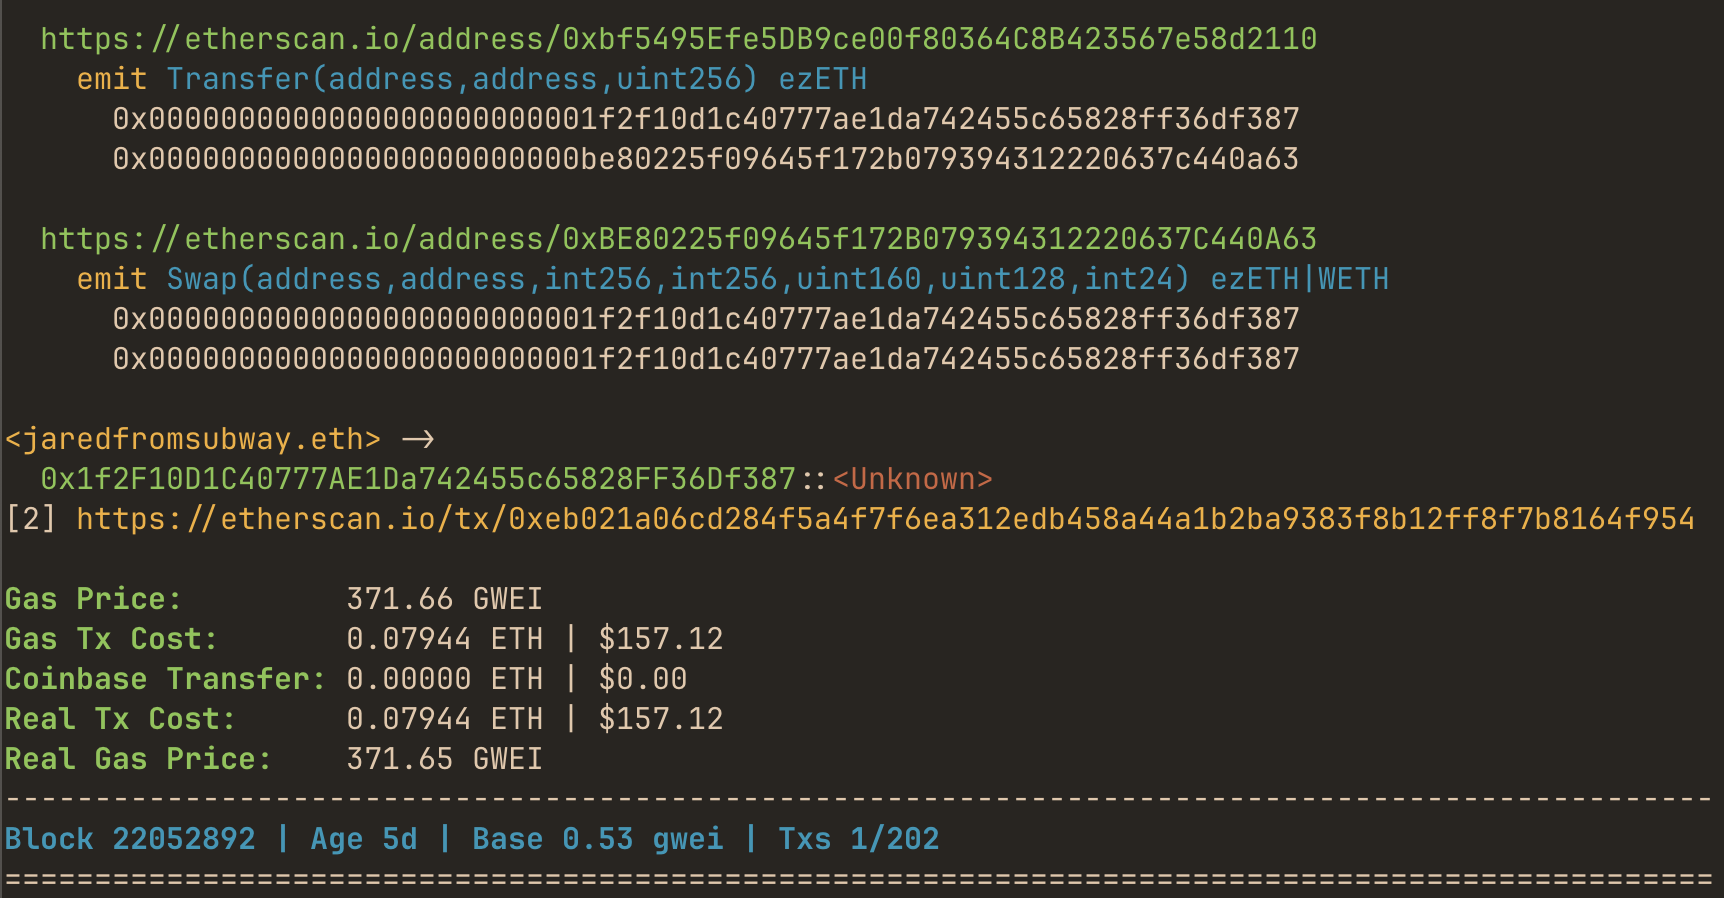
mevlog-rs CLI is inspired by cryo, mev-inspect-py, and cast run. It’s a command line tool that outputs EVM transaction details in a visual and quick-to-digest format:

I wanted to build a tool that makes it simple to query and lookup transactions using publicly accessible endpoints. If anything catches your interest you can use the more advanced tooling via clickable links to investigate further.
By using a local openchain.xyz signatures database mevlog displays human readable data instead of hex blobs. Root method calls and events provide an instant overview of what the transaction is all about. Thanks to EVM tracing capabilities, mevlog tracks how much bribe was paid to the coinbase and calculates the real effective gas price (i.e. (gas_price + bribe) / gas_used).
You can also filter transactions by regular expressions matching emitted event signatures and addresses.
Another feature is detecting tx storage changes, allowing to filter txs by smart contract addresses/ERC 20 tokens that were affected. There’s also ENS domains integration.
A few examples of currently supported queries:
- find
jaredfromsubway.ethtransactions from the last 20 blocks that landed in positions 0-5:
mevlog search -b 20:latest -p 0:5 --from jaredfromsubway.eth
- unknown method signature contract call in top position (likely an MEV bot):
mevlog search -b 10:latest --method "<Unknown>" -p 0
- query last 50 blocks for transactions in the top 10 slots that transferred PEPE token:
mevlog search -b 50:latest -p 0:10 --event "Transfer(address,address,uint256)|0x6982508145454ce325ddbe47a25d4ec3d2311933"
- blocks between 22034300 and 22034320, position 0 transaction that did not emit any
Swapevent:
mevlog search -b 22034300:22034320 -p 0 --not-event "/(Swap).+/"
- search blocks range for events containing
rebaseandTransferkeywords:
mevlog search -b 22045400:22045420 --event "/(?i)(rebase).+/" --event "/(Transfer).+/"
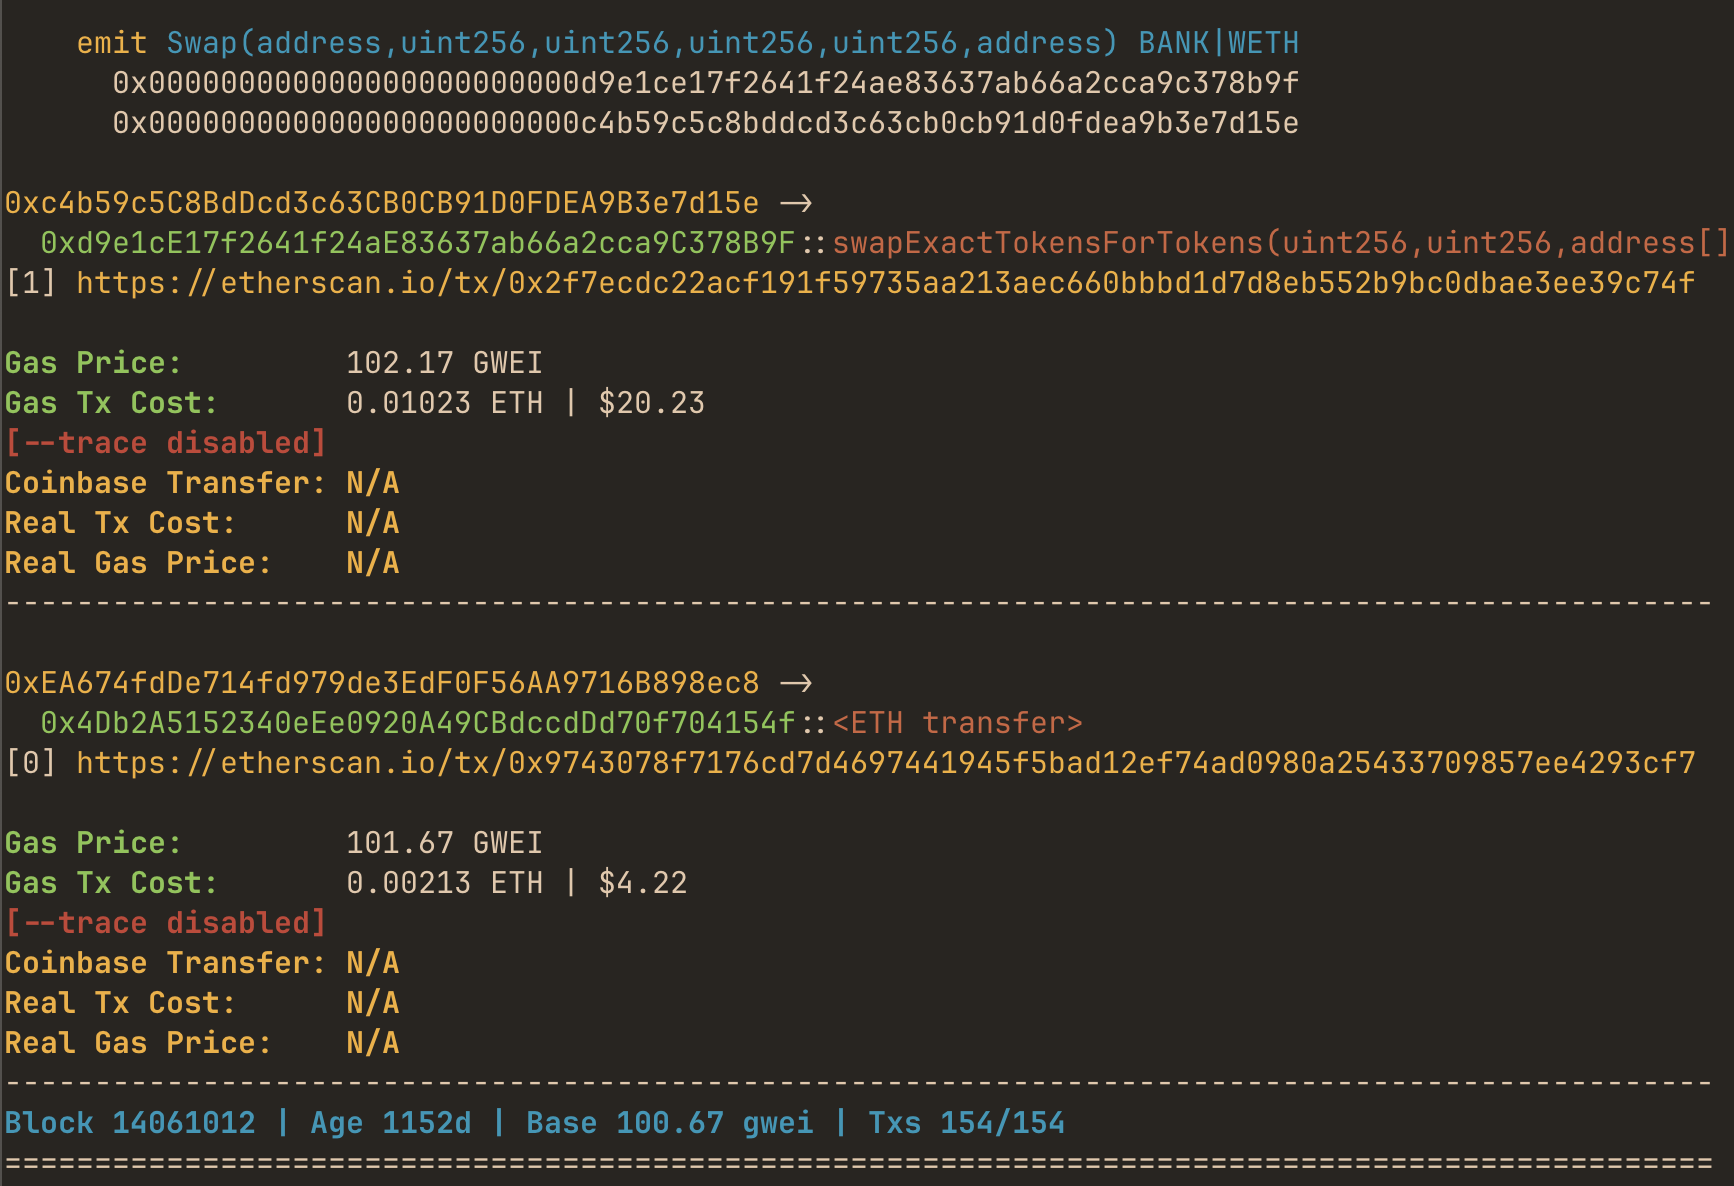
All the above queries use only standard block and logs input. It means that you can use publicly available RPC endpoints like https://eth.merkle.io and it should not get rate limited. These queries don’t need state data to execute so it works even for very old blocks on non-archive nodes:
mevlog search -b 14061012 --rpc-url https://eth.merkle.io

Revm-powered EVM tracing
By enabling --trace [rpc|revm] flag you can query by more conditions:
- query last 5 blocks for top transactions that paid over 0.002 ETH total (including coinbase bribe) transaction cost:
mevlog search -b 5:latest -p 0 --real-tx-cost ge20000000000000000 --trace revm

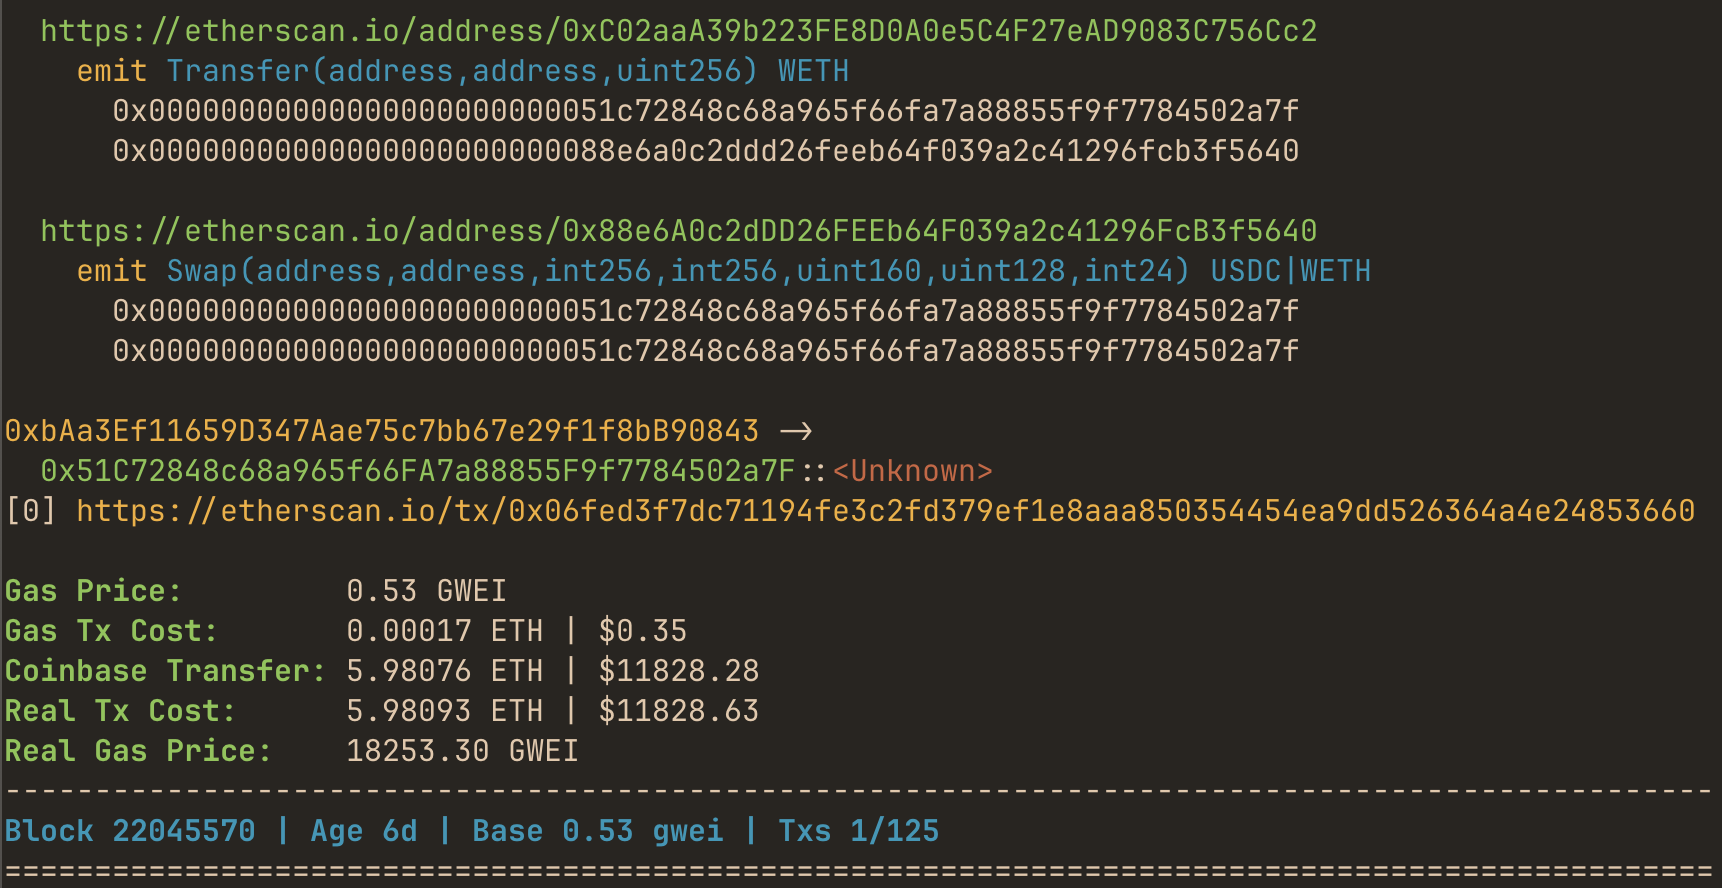
It shows how important it is to track coinbase transfers when analyzing tx costs. This tx paid only $0.33 in standard gas price but landed at the top on the block by bribing the validator over $11k.
You can also filter by real per gas price:
mevlog search -b 5:latest -p 0:5 --real-gas-price ge10000000000 --trace revm
It will display all the txs that paid more than 5 gwei of gas price per unit.
Another example of EVM tracing powered query:
- find txs that changed storage slots of the Balancer vault contract:
mevlog search -b 10:latest --touching 0xba12222222228d8ba445958a75a0704d566bf2c8 --trace rpc
It uses EVM state tracing to match contracts whose state was affected by transactions. It’s more general purpose than event-based filtering.
How to analyze MEV sandwich attacks?
mevlog tx method let’s you investigate a single transaction. A grep-like querying API allows to check what was the surrounding (potential sandwich) context. For example, after finding this jared tx in position 1 you can easily check what was the transaction that it backrunned:
mevlog tx -b 1 0x2aaf037240be70f05468c2c6d2e3fe948aea11783c3f90a2237c0c6978b6667b
In this particular example, it looks like it’s an rETH token oracle update.
If you want to investigate sandwich attacks by jared you can start from the following query:
mevlog search -b 20:latest -p 2 --from jaredfromsubway.eth
The lower “bun” of a sandwich is usually in the 2nd position in a block. After grabbing the tx hash you can see preceeding txs like this:
mevlog tx -B 2 0x29c93f92350f3dac6e729ccc5139345128b168ac15c0212854d171b8606a6358
It looks like this poor swap tx did indeed fall prey to jared.
There’s also a live monitoring mode supporting the same query methods as filter:
mevlog watch -p 0:5
I invite you to check out the repo for a full breakdown of the currently available filtering methods. You can start using the CLI by running:
git clone https://github.com/pawurb/mevlog-rs
cd mevlog-rs
cargo install --path .
or install from the crates.io:
cargo install mevlog
One installed you can run:
mevlog watch --rpc-url https://eth.merkle.io
I could not find a CLI tool with similar features. But please let me know in the comments if I’m reinventing the wheel.
Read on if you’re interested in the performance, usability, and EVM tracing-related challenges I’ve faced when building the MVP.
SQLite and ENS integration
Mevlog uses a local openchain.xyz signatures database. Compressed (~120MB) SQLite database file with ~800k event and over 2 million method signatures is downloaded on the first run. It allows to display human-readable info about emitted events and root method calls.
This is my first time using SQLite with this amount of data in a single table. It works seamlessly, fetching method signatures from the table with over 2 million rows in ~50-200µs (microseconds) per query. That’s 5-20 queries per millisecond! I’ve never seen similar numbers when working with PostgreSQL. Relying on locally cached SQLite enables the event and method name regexp search without using Etherscan API calls or parsing ABI files. Uncompressed database file currently weights ~260MB.
ENS integration was another interesting challenge. Initial implementation did 3 RPC calls to get the hashed node address, resolver, and eventually the name, causing ~400ms overhead per name lookup. For ~100 tx per block that’s 40s overhead. By moving node hash calculation off-chain and aggregating two remaining calls with a custom contract I’ve managed to reduce synchronous overhead to ~100ms.
Another optimization was delegating ENS resolutions to the cacache-rs file cache in the background thread. With these changes displaying ENS names has virtually no performance overhead.
Optimal EVM tracing strategies with Revm and RPC
However the most significant implementation challenge was adding the EVM tracing. We need to know how much ETH is bribed to the coinbase to calculate the real gas price. To do it, we need to extract an internal subtransaction trace with empty calldata and to set at the current coinbase.
This implementation is relatively simple for nodes that support the debug_traceTransaction RPC method. It’s possible to recursively extract subtraces output from the built-in {tracer: 'callTracer'} until there’s a match. But I wanted mevlog to also work with free nodes that don’t expose the debug APIs.
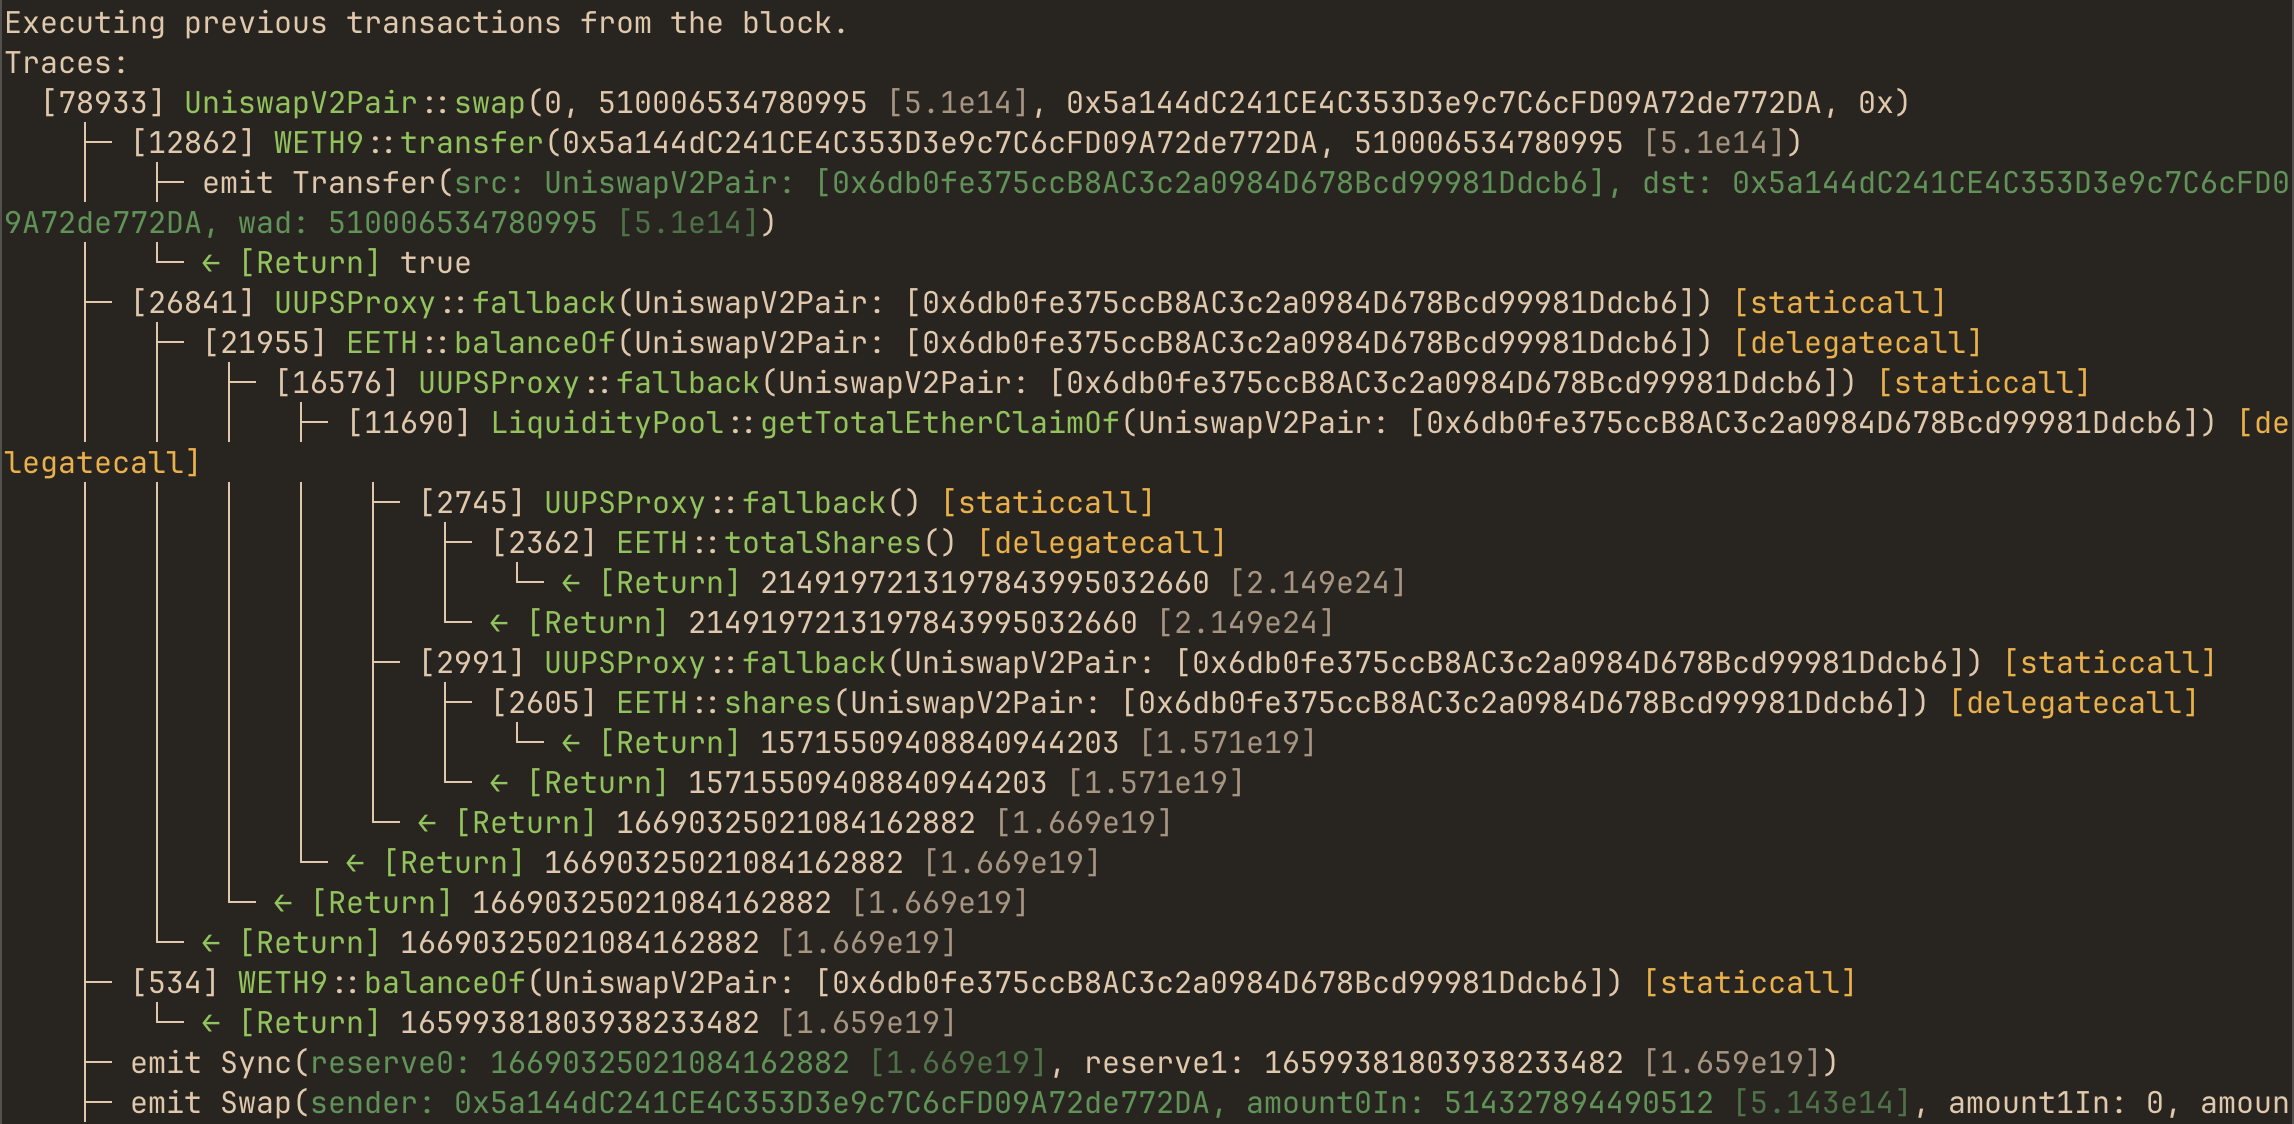
From my previous project, I knew that Revm supports tracing capabilities via the revm-inspectors crate. Actually, that’s what foundry uses under the hood for cast run 0x123... to print these detailed call traces:

"Executing previous transactions from the block" output is critical here. Contrary to debug_traceTransaction, Revm does not know the exact state of transactions further down the block, so to trace tx at slot 10 it has to first execute and commit the 9 preceeding txs. There’s a --quick flag that ignores previous state changes, but using it would fail most of the transactions.
I did not manage to wrap my head around the low-level Revm forking implementation of cast run. Instead I’ve used kind of a shortcut. To trace transactions from block N, mevlog spawns the Anvil process to fork off the N-1 block and uses Anvil provider with the Revm SharedBackend. Later, it passes the block N context to the Revm simulation engine and sequentially executes and traces all the transactions.
Let’s compare the performance of tracing the same transaction in the 10th slot with mevlog and cast run:
time mevlog tx 0x2884d487f3fa0c5d983abb415a25c3be0982b50d4107bdabead1498b652f38ad --trace revm
# 0.10s user 0.05s system 1% cpu 9.462 total
time cast run 0x2884d487f3fa0c5d983abb415a25c3be0982b50d4107bdabead1498b652f38ad
# 0.57s user 0.09s system 7% cpu 8.213 total
I’ve measured it against an external RPC endpoint, so any difference in performance is probably due to networking conditions. It indicates that despite the N-1 Anvil forking shenanigans mevlog --trace revm seems to be working correctly.
It’s worth noting that both commands rely on the foundry-fork-db crate. So subsequent traces against the same transactions will be much faster. In this case, it is down to ~1s. foundry-fork-db caches all the relevant data slots in a local file cache. Let’s see how much data is needed to execute the previously mentioned transaction:
RUST_LOG=debug cast run 0x2884d487f3fa0c5d983abb415a25c3be0982b50d4107bdabead1498b652f38ad
Based on the cast logs output, without cached data this command triggers over 200 RPC calls to the origin. That’s the price for running local Revm simulations because all the relevant storage slots must first be downloaded.
Mevlog also supports the --trace rpc mode that relies on the debug_traceTransaction method. It’s not available on free RPC endpoints, but it can trace transactions over 3rd party RPC in less than a second without caching. Revm-based simulations are great to compare different scenarios on the same storage dataset. But for one-off simulations (and especially for txs further down the block), RPC tracing will usually deliver a better performance.
For example, the first Revm tracing of top 50 txs from a sample block:
mevlog search -b 22053318 -p 0:50 --trace revm
# 0.75s user 0.43s system 4% cpu 24.437 total
second (with cache):
mevlog search -b 22053318 -p 0:50 --trace revm
# 0.21s user 0.08s system 10% cpu 2.618 total
and using RPC tracing:
mevlog search -b 22053318 -p 0:50 --trace rpc
# 0.10s user 0.09s system 2% cpu 8.260 total
and no tracing (i.e. no access to coinbase bribe data):
mevlog search -b 22053318 -p 0:50
# 0.06s user 0.05s system 6% cpu 1.749 total
Future plans
mevlog is currently in an MVP phase, and many implementation details are far from optimal. Let’s see how long it takes to query the last 1000 blocks for matching event names on a local Geth node:
time mevlog search -b 1000:latest --event "Sync(uint112,uin112)"
# real    2m55.397s
# user    1m28.724s
# sys     1m12.775s
and last 250 blocks with revm tracing:
time mevlog search -b 250:latest --event "Sync(uint112,uin112)" --trace revm
# real    3m24.163s
# user    0m46.712s
# sys     0m26.668s

In its current state, mevlog is only useful for small block ranges querying and live monitoring. For example, the current search implementation is terribly inneficient fetching logs and transactions data block by block without any batching or concurrency.
For future releases I’m considering to piggyback on the cryo crate for data extraction. Let’s compare the numbers for fetching the last 1000 blocks data:
cryo blocks logs transactions --blocks -1000:latest
# collection summary
# ──────────────────
# - total duration: 6.556 seconds
# - total chunks: 2
#     - chunks errored:   0 / 2 (0.0%)
#     - chunks skipped:   0 / 2 (0.0%)
#     - chunks collected: 2 / 2 (100.0%)
# - blocks collected: 1,000
#     - blocks per second:     152.5
#     - blocks per minute:   9,151.0
#     - blocks per hour:   549,062.7
#     - blocks per day: 13,177,503.7
# - rows written: 552,669
That’s a decent ~98% speedup. With this setup, mevlog could provide a performant, MEV-focused querying API on top of cryo.
Summary
mevlog-rs is in the beta stage so any feedback would be appreciated. I’m just starting to use it for my daily searching tasks. But it already helped me discover and execute a long-tail MEV strategy on the Mainnet. Next week I’m planning to release a detailed post describing the process, so stay tuned for updates.

