By default, Rails ActiveRecord executes most of the SQL queries in a non-optimal way. In this blog post, I’ll describe how to fix this issue to speed up bottlenecks and reduce memory usage.
Bloated ActiveRecord queries
Active Record empowers developers to write fairly complex database queries without understanding the underlying SQL. Unfortunately, the same ActiveRecord is a reason for the majority of the issues that I encounter while conducting my Rails performance audits. Next to the infamous N+1 calls, “bloated” queries are another common problem.
Let’s see it in action:
app/models/user.rb
class User < ApplicationRecord
  # == Schema Information
  #
  # Table name: users
  #
  #  id                     :bigint           not null, primary key
  #  api_auth_token         :string           not null
  #  block_uuid             :uuid
  #  blocked_from           :datetime
  #  blocked_until          :datetime
  #  messaging_active_today :boolean          default(FALSE), not null
  #  pseudonym              :string
  #  uuid                   :uuid             not null
  #  voting_active_today    :boolean          default(FALSE), not null
  #  web_auth_token         :string
  #  team_id                :integer          not null

  # ...

  def blocked?
    return false if blocked_until.nil?
    blocked_until < Time.current
  end
endapp/controllers/users_controller.rb
class UsersController < ApplicationController
  def index
    @users = User.order(:updated_at).limit(200)
  end
end
app/views/users/index.html.erb
<div>
  <% @users.each do |user| %>
    <div>
      ID: <%= user.id %>
      Blocked: <%= user.blocked? %>
    </div>
  <% end %>
</div>
It is common for core models in legacy Rails projects to consist of dozens of columns. In the above example, we fetch 200 rows from the database and display info based on the logic implemented in a User model.
SQL query executed in the controlled looks like that:
SELECT "users".* FROM "users" ORDER BY "updated_at" ASC LIMIT 200
Can you spot the issue now? A little hint: *
By default, ActiveRecord fetches ALL the model columns. But, in the above example, we only really need the id and blocked_until columns for our view to display correctly. If you only care about raw data, a recommended practice is using the ActiveRecord pluck method to avoid the overhead of instantiating model objects.
But, in this case, we need the model logic. So to improve performance, we can use a select method:
class UsersController < ApplicationController
  def index
    @users = User.order(:updated_at).select(:id, :blocked_until).limit(200)
  end
end
The above implementation would produce the following SQL query:
SELECT "users"."id", "users"."blocked_until" FROM "users" ORDER BY "updated_at" ASC LIMIT 200
Contrary to pluck, chaining a select method would still return ActiveRecord object instances, so you’ll be able to call methods implemented in the model. One catch is that if you try to read a value from a column that was not fetched from the database, an ActiveModel::MissingAttributeError would be raised.
How to reduce ActiveRecord RAM usage
Now that we’ve discussed how to slim down bloated queries, let’s measure the potential impact on memory usage. memory_profiler gem offers a simple API for measuring in-memory object allocations.
Let’s start with checking how many objects are allocated when we fetch 1000 instances of a sample model with 12 columns:
MemoryProfiler.report do
  User.limit(1000).to_a; 0;
end.pretty_print0; to prevent IRB from printing the query output to the console and skew memory usage results.MemoryProfiler outputs loads of data, but we’re interested in the top few lines:
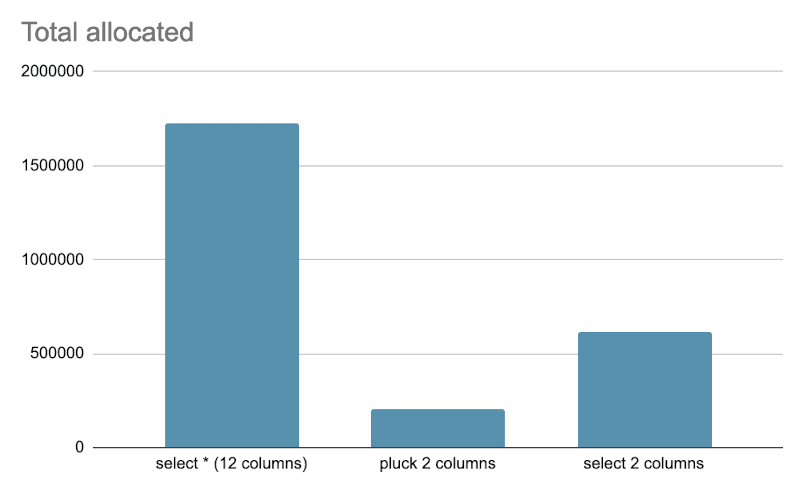
Total allocated: 1723042 bytes (11577 objects)
Total retained:  1536160 bytes (10183 objects)

allocated memory by gem
-----------------------------------
   1522398  activerecord-7.0.4
    176080  activemodel-7.0.4
    ...
Total allocated: 1723042 bytes represents memory usage increase caused by running the code snippet. The absolute value is not important, but it will serve as a reference point when we compare more efficient ways to run this query. The absolute memory usage would vary based on total columns number and the model implementation.
Let’s now see how memory usage looks if we pluck two columns:
MemoryProfiler.report do
  User.limit(1000).pluck(:id, :blocked_until); 0;
end.pretty_print
Total allocated: 204350 bytes (4422 objects)
Total retained: 3252 bytes (48 objects)
allocated memory by gem
-----------------------------------
141347 activerecord-7.0.4
40040 local/lib
...That’s a ~90% decrease! But, as previously mentioned, pluck could be limiting in some cases since it returns raw data instead of model objects. So let’s now measure the memory impact of using select to fetch only two columns:
MemoryProfiler.report do
  User.limit(1000).select(:id, :blocked_until).to_a; 0;
end.pretty_print
Total allocated: 613271 bytes (7432 objects)
Total retained: 531648 bytes (6055 objects)
allocated memory by gem
-----------------------------------
412930 activerecord-7.0.4
176080 activemodel-7.0.4
...That’s ~65% less than the original * query. And you can still interact with full model APIs as long as non-fetched column values are not accessed.

Another advantage of putting bloated SQL queries on a diet is that fetching less columns will decrease the number of disk-read operations. Database read IOPS are sometimes a bottleneck for apps with larger traffic. Fetching fewer columns is a relatively straightforward way to improve this metric.
Summary
Like with most SQL-related issues, the benefits of fine-tuning queries will only provide measurable effect once the app and dataset reach a certain scale. But, I’ve seen significant performance and memory usage improvements from limiting columns fetched from the database. You can check out my blog post about rails-pg-extras to learn how to find queries that are likely to benefit from this optimization technique.

