Fixing N+1 issues is often the lowest-hanging fruit in optimizing a Rails app performance. However, for non-trivial cases choosing a correct fix could be challenging. Incorrectly applied eager loading does not work or even worsens response times. In this blog post, I describe tools and techniques I use to simplify resolving N+1 issues.
How to simulate N+1 issues in development
I doubt the Rails blogosphere needs yet another introduction to N+1 queries. You can check out my previous post for a quick recap.
Instead, let’s discuss how to establish a repeatable routine for spotting N+1 issues before they start manifesting in production. It’s common for developers to work with a minimal local data set. Unfortunately, working with a database resembling production is usually not possible. But seeding local data for your test user to mimic production sizes could be a perfect compromise.
Hundreds of test objects will not be enough to simulate slow SQL queries. PostgreSQL usually needs tens of thousands of table rows for any SQL-layer slowdown to manifest. But N+1 query issues are not related to absolute collection sizes but to how you use and misuse ActiveRecord ORM. A dozen objects are enough to trigger N+1 issues and make them detectable during development.
A simple way to quickly populate your local data is to use a FactoryBot gem. You may already have used it in your project but did not consider leveraging it to seed development env. To do it you have to include the gem in development group of your Gemfile. Now in the Rails console:
require 'factory_bot'

100.times do
  FactoryBot.create(:post, user: your_test_user)
end

#...
Of course, the exact implementation will be unique for each project. But leveraging existing factories should simplify the process compared to writing seed scripts from scratch.
Another benefit of working with a larger local collection is that you’ll spot places likely to benefit from pagination. Before endless lists, bring your production servers to a crawl…
How to analyze and debug local N+1 issues
Now that you have a decent local dataset, you can start digging deeper. bullet gem is a popular tools for reporting N+1 issues. However, its log output is a bit noisy or even illegible for larger projects. I’ve also seen it report many false positives so extracting actionable data it could be challenging. Instead, I usually default to the good ol’ rack-mini-profiler gem:

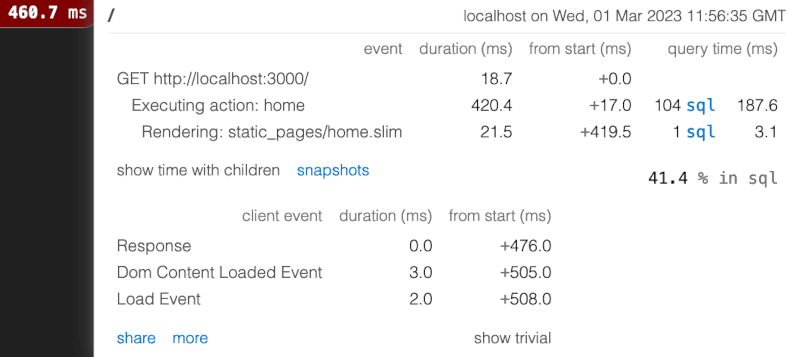
The popup window shows the number of SQL queries executed per request. It even works with XHR requests. So, if you’re using a SPA framework, you can check quickly how many queries are triggered by each API endpoint.
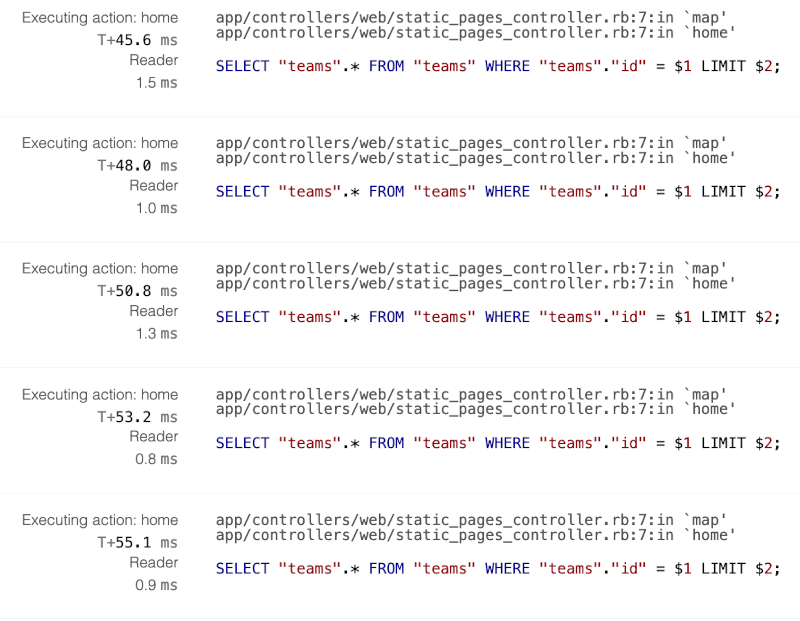
Another great feature is that you can see the exact line of code that triggered each query:

For many more straightforward cases, this data is enough to track the missing eager loading and validate the fix. But it’s normal for legacy projects to trigger thousands of queries per view. If that is the case making sense of rack-mini-profiler endless backtraces data could be overwhelming. That why I’ve recently developed a way to simplify this process.
After expanding the traces data, click CMD+A and CMD+C to copy it into the clipboard. Now create a new empty text file and paste clipboard contents. I recommend using vim because modern text editors might not handle larger clipboard sizes. Now you can run the following bash script:
sort traces.txt | uniq -c | sort -bgr > output.txtIt groups and counts the unique lines, and pipes output into a new text file. Now on top of this file, you can see which kinds of queries and method execution hits were repeated most often:
 ...
 119 Reader
 118 Executing action: home
 101 app/controllers/web/static_pages_controller.rb:7:in `home'
 101 SELECT "teams".* FROM "teams" WHERE "teams"."id" = $1 LIMIT $2;
 100 app/controllers/web/static_pages_controller.rb:7:in `map'
 ...
It’s usually enough data to spot precisely where the worse N+1 issues originate from and to validate if the fix resolved the problem.
Use rails-pg-extras to dissect N+1 queries
As you can see, the rack-mini-profiler works for many standard scenarios. However, it’s sometimes a lot of work to simulate certain edge cases in the app’s UI. Also, the workflow of manually copying, parsing, and analyzing log outputs is far from ideal. So, I’ve recently released a small tool that helps me iterate on N+1 issues faster.
My rails-pg-extras gem has been around for a while. It includes an array of helper methods for analyzing the internals of your PostgreSQL database. measure_queries method is the newest addition to the lib’s API. It leverages ActiveSupport instrumentation to display queries executed by running any provided Ruby snippet:
RailsPgExtras.measure_queries { User.limit(10).map(&:team) }

{:count=>11,
 :queries=>
  {"SELECT \"users\".* FROM \"users\" LIMIT $1"=>
    {:count=>1,
     :total_duration=>1.9,
     :min_duration=>1.9,
     :max_duration=>1.9,
     :avg_duration=>1.9},
   "SELECT \"teams\".* FROM \"teams\" WHERE \"teams\".\"id\" = $1 LIMIT $2"=>
    {:count=>10,
     :total_duration=>0.94,
     :min_duration=>0.62,
     :max_duration=>1.37,
     :avg_duration=>0.94}},
 :total_duration=>13.35,
 :sql_duration=>11.34}
In theory, you can extract the same data by piping ActiveRecord logging to STDOUT:
ActiveRecord::Base.logger = Logger.new(STDOUT)Produces:
D, [2023-03-01T13:57:42.815016 #19045] DEBUG -- :   User Load (1.6ms)  SELECT "users".* FROM "users" ORDER BY "users"."id" DESC LIMIT $1  [["LIMIT", 20]]
D, [2023-03-01T13:57:42.817497 #19045] DEBUG -- :   Team Load (2.1ms)  SELECT "teams".* FROM "teams" WHERE "teams"."id" = $1 LIMIT $2  [["id", "[FILTERED]"], ["LIMIT", 1]]
D, [2023-03-01T13:57:42.819068 #19045] DEBUG -- :   Team Load (1.2ms)  SELECT "teams".* FROM "teams" WHERE "teams"."id" = $1 LIMIT $2  [["id", "[FILTERED]"], ["LIMIT", 1]]
(.....N+1 more lines.....)
D, [2023-03-01T13:57:42.843380 #19045] DEBUG -- :   Team Load (1.0ms)  SELECT "teams".* FROM "teams" WHERE "teams"."id" = $1 LIMIT $2  [["id", "[FILTERED]"], ["LIMIT", 1]]
D, [2023-03-01T13:57:42.844977 #19045] DEBUG -- :   Team Load (1.4ms)  SELECT "teams".* FROM "teams" WHERE "teams"."id" = $1 LIMIT $2  [["id", "[FILTERED]"], ["LIMIT", 1]]
But it’s arguably less readable. And for more complex cases, it is likely to produce an endless log stream instead of an easy-to-comprehend hash aggregating all the necessary data.
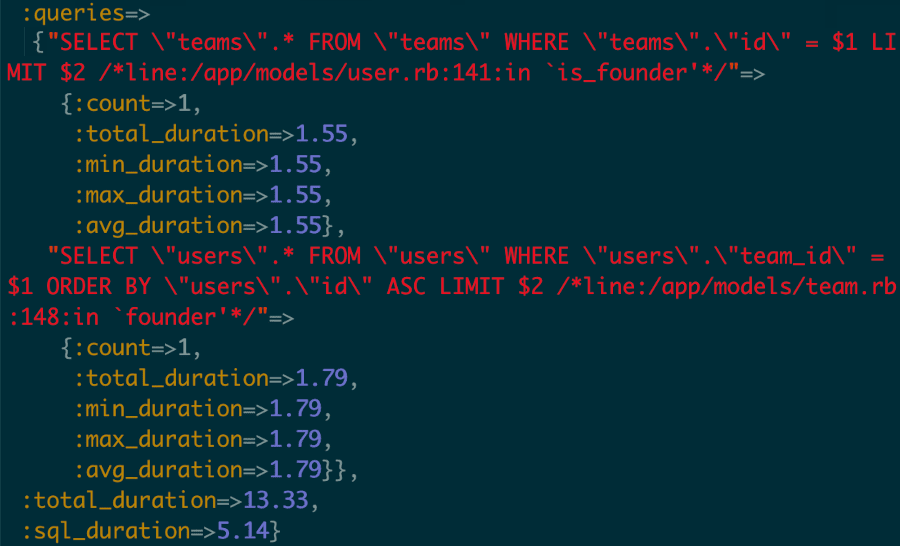
Optionally, with the help of marginalia gem, you can add backtraces info to standard ActiveRecord logs output. As an effect it will be included in the measured queries data:

You have to configure Marginalia to enable this feature:
config/development.rb
Marginalia::Comment.components = [:line]I’m using the measure_queries helper method for my ongoing Rails performance audits. It has significantly improved my workflow allowing for faster iteration on N+1 related fixes. I no longer have to use a rack-mini-profiler UI. Instead, I can now apply the change, type reload! (aliased to re) straight in the Rails console and quickly measure if a refactored method is faster and triggers fewer queries. Being able to debug on the lower layer of models/services instead of HTTP endpoints is a huge productivity boost.
Since this API is relatively new I’m open to feedback on improving it.
Use specs to prevent N+1 queries
Another way to keep the N+1 problem under control is to leverage your test suite. You can use the same measure_queries to constraint how many queries any Ruby code snippet is allowed to trigger. Arguably the simplest way to use it is on a per-endpoint level with controller specs:
describe UsersController do
  # ...

  describe "index" do
    it "does not exceed queries limit" do
      queries = RailsPgExtras.measure_queries do
        get :index
      end
      expect(queries.fetch(:count)).to be < 5
    end
  end
end
The above spec will fail if the number of queries exceeds a predefined threshold. Alternatively, you can check out the n_plus_one_control gem for more complex rspec matchers related to N+1 queries.
Summary
With adequate tooling, it’s possible to spot and resolve N+1 issues before they reach production. I hope that some of the above tips will help you improve your workflow when fixing these problems.

